Links

Saturday, September 3, 2016

Next generation silicon economy

It is clear that there is an architecture that has emerged that will drive the next generation silicon based economy. At a high level, the overall architecture consists of

1. An energy source
2. A processing module
3. An onboard memory module
3. A data storage module (optional)
4. A learning module
5. A controller to do stuff.
6. A communication mechanism

A Raspberry Pi is a good albeit incomplete reference design for this architecture. If we look at Pi Zero (https://www.raspberrypi.org/products/pi-zero/), which is selling for a mere $5, it includes the bare minimum elements required to fulfill such an architecture.

Pi_Zero_v1.2

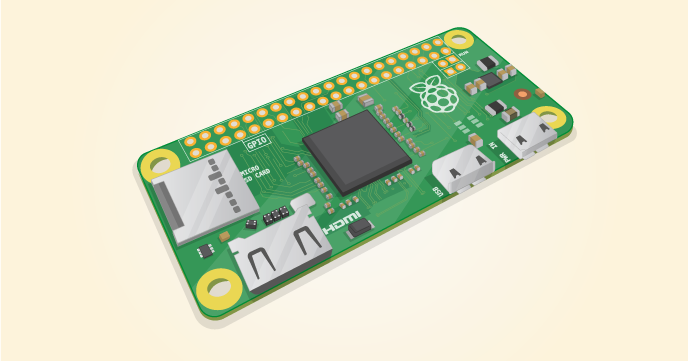
Included elements in Pi Zero

Out of the box Pi Zero includes a processing module with interfaces that can be used to plug in other modules.

1. An energy input interface (Micro USB power)
2. A processing module (1Ghz, Single-core CPU)
3. An onboard memory module (512MB RAM)
3. A data storage module interface (A Micro SD card slot)
4. A learning module (We can deploy R or Python on a Pi Zero)
5. A controller interface (HAT-compatible 40-pin header)
6. A communication mechanism interface (Mini HDMI and USB On-The-Go ports to plug in USB dongle)

Given the above, the Pi Zero is an excellent prototype of how these architectures will evolve. As can be noticed from above, these interfaces while allowing flexibility, lack the full build out of the architecture. In many ways, the Pi Zero unit is going to be the brick of the world of Internet of Everything.

The Winners

As in the pre-IoT days, the dollars will go to solution integrators vs. component manufacturers, unless the component manufacturers manage to brand themselves and allow commoditization of the integrators. A strong DIY model with open-source solutions is a way to do just that. If that happens market power will go to the retail channels such as Amazon and others. Overall, it will be interesting to see how the market evolves for this space.

Saturday, March 5, 2016

First Solar Target Price for next quarter Q1 2016

Even though JP Morgan analyst recently mentioned that at $69, First Solar is fully priced, there is a possibility that stock might move up.

If we look at the trailing 12 months of EPS, the stock has an EPS of 5.35 and a P/E ratio of around 12.99.


Now, the last 3 quarters of the year were quite good and if we add the next quarter estimates, (see below) the Trailing Twelve Months EPS will be around 6.5 (even if you don't agree with my estimates).

At a P/E of 13, this means a stock at around $87, and if the P/E also comes close to a realistic value of 15 given the growth potential of First Solar, we could go all the way to $100.

Something to think about, when the next earnings are coming out.

Sunday, February 21, 2016

Evaluating Intel based on Value Investing by Graham

Reading across blogs today, I came across a blog that documented Benjamin Graham's formula that he adopted after 1970.

These were as follows:

1. An earnings-to-price yield at least twice the AAA bond rate.
2. A P/E ratio less than 40% of the highest P/E ratio the stock had had over the past 5 years.
3. A dividend yield of at least ⅔ of the AAA bond yield.
4. A stock price below ⅔ of tangible book value per share.
5. A stock price below ⅔ of Net Current Asset Value.
6. A total debt less than book value.
7. A current ratio greater than 2.
8. A total debt less than 2 times Net Current Asset Value
9. An earnings growth of prior 10 years at a minimum 7% annual compound rate
10. Stability in growth of earnings with no more than 2 declines of 5% or more in year end earnings in the ten years prior are permissible.


Taking Intel as an example, we will test each of these metrics to see how Intel scores.

1. An earnings-to-price yield at least twice the AAA bond rate.

>> At the time of writing this blog post, this is around 4.01%. Taking Intel (INTC) as an example, the current rate is around 8.15%. 

2. A P/E ratio less than 40% of the highest P/E ratio the stock had had over the past 5 years.

>> For Intel, its 12.26% as shown below, which is around 69.2% of the highest PE for Intel of 17.70 in past 5 years.


3. A dividend yield of at least ⅔ of the AAA bond yield.

>> Current Intel dividend yield is 3.41% which is higher than 2/3rd of 4.01%

4. A stock price below ⅔ of tangible book value per share.

>> This is not true. INTC is trading at $28.71, where as book value per share is $12.93

5. A stock price below ⅔ of Net Current Asset Value.

>> This is not true. Intel's Net Current Asset Value was around $6 (= Current Assets - Current Liabilities / Total shares)

6. A total debt less than book value.

>> Intel's total debt is around $22.6B and book value is $103B

7. A current ratio greater than 2.

>> Intel's current ratio is 2.58

8. A total debt less than 2 times Net Current Asset Value

>> Total debt is around $22.B and Net Current Asset Value is around $25B

9. An earnings growth of prior 10 years at a minimum 7% annual compound rate

>> Earnings growth of prior 10 years at Intel is around 1 to 2% at best

10. Stability in growth of earnings with no more than 2 declines of 5% or more in year end earnings in the ten years prior are permissible.

>> This is probably true.

Overall, Intel misses on a few tests but comes out strong on several others.